Relationships Between Plasma Lipids Species, Gender, Risk Factors, and Alzheimer’s Disease
Abstract
Background:
Lipid metabolism is altered in Alzheimer’s disease (AD); however, the relationship between AD risk factors (age, APOE ɛ4, and gender) and lipid metabolism is not well defined.
Objective:
We investigated whether altered lipid metabolism associated with increased age, gender, and APOE status may contribute to the development of AD by examining these risk factors in healthy controls and also clinically diagnosed AD individuals.
Methods:
We performed plasma lipidomic profiling (582 lipid species) of the Australian Imaging, Biomarkers and Lifestyle flagship study of aging cohort (AIBL) using liquid chromatography-mass spectrometry. Linear regression and interaction analysis were used to explore the relationship between risk factors and plasma lipid species.
Results:
We observed strong associations between plasma lipid species with gender and increasing age in cognitively normal individuals. However, APOE ɛ4 was relatively weakly associated with plasma lipid species. Interaction analysis identified differential associations of sphingolipids and polyunsaturated fatty acid esterified lipid species with AD based on age and gender, respectively. These data indicate that the risk associated with age, gender, and APOE ɛ4 may, in part, be mediated by changes in lipid metabolism.
Conclusion:
This study extends our existing knowledge of the relationship between the lipidome and AD and highlights the complexity of the relationships between lipid metabolism and AD at different ages and between men and women. This has important implications for how we assess AD risk and also for potential therapeutic strategies involving modulation of lipid metabolic pathways.
INTRODUCTION
Alzheimer’s disease (AD) is a progressive neurodegenerative disease associated with cognitive impairment and is the most common form of dementia. Increasing age is a major risk factor for AD [1] and is driving the current increases in AD. Aging is also associated with changes in lipid metabolism in brain regions playing crucial roles in cognitive function [2, 3] which is reflected in the periphery [4].
The ɛ4 allele of the apolipoprotein E gene (APOE) is the strongest genetic risk factor for the sporadic form of AD [5]. Individuals with two copies of the ɛ4 allele have been reported to have a 14-fold increased risk of developing both late onset and early onset sporadic AD. Given the role of apolipoprotein E protein (ApoE) in lipid transport and metabolism, investigating the influences of different APOE alleles on lipid metabolism is warranted.
Recent studies have indicated that gender may be a potential risk factor for sporadic AD, and that females are more susceptible to developing sporadic AD, even after accounting for differences in longevity [6, 7]. In addition, gender may influence other risk factors, such that men will be affected differently to women [7]. We have previously reported on strong associations between many lipid species and gender [4, 8].
Lipids play an essential role in all mammalian systems. Recent lipidomic studies have identified multiple lipid classes and species associated with AD, at both preclinical and clinical stages [9, 10]. These studies have suggested that phospholipid, ceramide, and sulfatide metabolism may be involved in AD pathogenesis. Significant differences in ether lipids and plasmalogens have also been reported in AD studies which investigated both brain and serum lipid species [11–13]. While the exact mechanism(s) of AD pathogenesis are yet to be fully elucidated, considerable evidence indicates the involvement of aberrant lipid metabolism [11, 14]. In this study we sought to better define the associations of AD and its major risk factors (age, gender, and APOE) with the plasma lipidome, and in particular, define how age, gender, and APOE interact with the associations between AD and the plasma lipidome.
MATERIALS AND METHODS
Participants
The current study utilized plasma samples and data from the Australian Imaging, Biomarkers and Lifestyle (AIBL) flagship study of aging, which recruited 1,112 individuals over the age of 60 years into a longitudinal study (follow-up at 18-month intervals) for AD. In this paper, cross-sectional data to the latest available time point were used to maximize the number of participants available because at the later time points there were more dropouts. Time points were used as a covariate to remove any association based on time point.
The AIBL study was approved by the institutional ethics committees of Austin Health, St Vincent’s Health, Hollywood Private Hospital and Edith Cowan University. Written informed consent was given by all volunteers before participating in the study. Individuals with a history of non-AD dementia, schizophrenia, bipolar disorder, significant current depression, Parkinson’s disease, cancer (other than basal cell skin carcinoma) within the last two years, symptomatic stroke, uncontrolled diabetes, or current regular alcohol use exceeding two standard drinks per day for women or four per day for men, were excluded from the study [15]. Details of the selection criteria can be found in Ellis et al. [15].
Blood collection and storage, APOE genotyping
All study volunteers fasted for a minimum of 10 h overnight prior to blood collection. Blood draw was carried out using standard serologic techniques and fractionated as described previously by Ellis et al. [15] followed by storage at –80°C for research. Within the current study, lipid metabolites were measured in the plasma.
Apolipoprotein E (APOE) genotype was determined following extraction and purification of genomic DNA from 0.5 ml whole blood. Each sample was genotyped for the presence of the three APOE variants (ɛ2, ɛ3, and ɛ4) based on TaqMan SNP genotyping assays for rs7412 (C 904973) and rs429358 (C 3084793) as per the manufacturer’s instructions (AB Applied Biosystems by Life Technologies, Victoria, Australia).
Lipid extraction and lipidomic analysis
Lipid species were extracted from 10μL plasma, with the addition of an internal standard mix (Supplementary Table 3), using the single phase butanol/methanol extraction method as described previously [16]. 10μL aliquots of plasma were mixed with 100μL of 1-butanol:methanol (1:1 v/v) with 5 mM ammonium formate containing an internal standard mix. The mixture was vortexed for 10 s and sonicated for 60 min in a sonic water bath at 25°C and then centrifuged (16,000×g, 10 min, 20°C). The supernatant was transferred into a 0.2 mL glass insert with Teflon insert cap for analysis by ultra-performance liquid chromatography electrospray ionization tandem mass spectrometry.
The solvent system consisted of solvent A) 50% H2O/30% acetonitrile/20% isopropanol (v/v/v) containing 10 mM ammonium formate) and solvent B) 1% H2O/9% acetonitrile/90% isopropanol (v/v/v) containing 10 mM ammonium formate. The following mass spectrometer conditions were used; gas temperature, 150°C, gas flow rate 17 L/min, nebulizer 20 psi, Sheath gas temperature 200°C, capillary voltage 3500 V and sheath gas flow 10 L/min.
Plasma quality control (PQC) samples consisting of a pooled set of 6 healthy individuals were incorporated into the analysis at 1 PQC per 18 plasma samples. Technical quality control samples (TQC) consisted of PQC extracts which were pooled and split into individual vials to provide a measure of technical variation from the mass spectrometer only. These were included at a ratio of 1 TQC per 18 plasma samples. TQCs were monitored for changes in peak area, width and retention time to determine the performance of the LC-MS/MS analysis and the PQCs were subsequently used to align for differential responses across the analytical batches.
Characterization of phospholipid isomers
The fatty acid composition of phospholipids was characterized by either collision induced dissociation (CID) in negative ionization mode, for neutral or negatively charged species, or by CID of lithium adducts in positive ionization mode for positively charged species and subsequently used to infer structural composition on our chromatography. Fragmentation in negative mode enabled the identification of fragment ions corresponding to the fatty acyl species. Fragmentation of the lithium adducts in positive ion mode enabled identification of fragment ions corresponding to the loss of the fatty acyl constituents. Characterization of the phospholipid fatty acids was performed on whole lipid extracts of PQC samples. For the analysis of lithium adducts of phosphatidylcholine, alkylphosphatidylcholine, alkenylphosphatidylcholine, and sphingomyelin, the 10 mM ammonium formate in the extraction buffer and running solvents were substituted with 200μM lithium acetate, which provided the ability to monitor for lithium adducts for additional structural information.
Liquid chromatography mass spectrometry
Analysis of plasma extracts was performed on an Agilent 6490 QQQ mass spectrometer with an Agilent 1290 series HPLC system and a ZORBAX eclipse plus C18 column (2.1×100 mm, 1.8μm, Agilent) with the thermostat set at 60°C [8]. Mass spectrometry analysis was performed in positive ion mode, with dynamic scheduled multiple reaction monitoring (MRM). Mass spectrometry settings and MRM transitions for each lipid class are shown in Supplementary Table 3. Detailed description of the method is presented in Huynh et al. [8].
Data integration, batch alignment, and statistical analysis
Data integration was carried out using Agilent Mass Hunter version 8.0. Each batch was aligned using its PQC samples and log transformed prior to statistical analysis. A total of 582 lipid species were used for analysis. Statistical analysis was carried out using R version 3.4.1 for linear and logistical modelling with covariates. For linear regression, data was not mean centered and standard deviation scaled to allow the coefficients to be back transformed into percentage change for interpretation. For logistic regression, data was mean centered and standard deviation scaled. Sporadic missing values (∼5%) were observed for (BMI, total cholesterol, HDL-C, and triglycerides) in the AIBL clinical database. To avoid exclusion of entire samples due to such missing values, we utilized multiple imputations by chained equations [17] to estimate these parameters utilizing other related clinical variables (age, sex, BMI, HDL-C, total cholesterol, and triglycerides). Every time we imputed, we used a subset of these variables (age, sex, BMI, HDL-C, total cholesterol, and triglycerides).
Associations between risk factors (age, gender, and APOE ɛ4) and lipid species (as outcomes) were determined using linear regression of the latest available samples from individuals who did not develop MCI or AD. These analyses were adjusted for the other risk factors (age, gender, and APOE ɛ4) as appropriate, in addition to BMI, total cholesterol, HDL-C, triglycerides, site of collection and time point, statin treatment, and omega 3 supplementation as indicated. β-coefficients and 95% confidence intervals were converted to percentage change (percentage change = (10∧β-coefficient–1)×100). Covariates involving statin treatment or DHA intake (fish oil, krill oil) were treated as binary variables. Correction for multiple comparison was by the method of Benjamini and Hochberg. For interaction analysis with age, gender, or APOE ɛ4, binary variables were used, where male = 1, age >75 = 1 and one or more copies of ɛ4 = 1.
Interaction analyses (2-df) tested each lipid metabolite individually on a binary risk factor (+additional covariates as stated) with AD as the outcome. For each binary risk factor (Age >75, Sex, APOE ɛ4) two models were used with the assignment of the risk factor switched between 0 and 1 for each model. This provided associations (coefficient, CI, and significance) between each lipid and AD for both risk groups (i.e., male and female) to aid in interpretation of the interaction.
Naming convention of lipid species
The lipid naming convention used here follows the guidelines established by the Lipid Maps Consortium and the shorthand notation established by Liebisch et al. [18, 19]. Glycerophospholipids typically contain two fatty acid chains and in the absence of detailed characterization are expressed as the sum composition of carbon atoms and double bonds (i.e., the phosphatidylcholine species, PC(38:6). However, where an acyl chain composition has been determined the naming convention indicates this (i.e., PC(38:6) is renamed to PC(16:0_22:6), where the sn1 and sn2 positions are unknown or to PC(16:0/22:6) where the sn positions are known). This is also extended into other lipid classes and subclasses.
Species separated chromatographically but incompletely characterized were labelled with an (a) or (b), for example the phosphatidylcholine plasmalogen species, PC(P-17:0/20:4) (a) and (b) where (a) and (b) represent the elution order. Triglyceride species are measured using a single neutral loss experiment and are represented as their sum composition with their neutral loss experiment (i.e., TG(56:2) [NL-18:2]).
RESULTS
Associations of plasma lipid species with risk factors for Alzheimer’s disease
We examined the associations between lipid species and risk factors for AD (age, gender, and APOE ɛ4 status) utilizing the most recent time-point sample of non-MCI/AD individuals (controls). Participant characteristics (at the time of sample) are shown in Supplementary Table 1.
Age was associated with 195 lipid species (corrected for multiple comparisons) after adjusting for gender, BMI, site of collection, and collection time-point. When further adjustment for clinical lipids (total cholesterol, HDL-C, and triglycerides) was performed, age was associated with 153 lipid species. A summary of these associations is presented in Fig. 1, and further details can be found in Supplementary Table 2. Acylcarnitine species showed the strongest association with increasing age (Fig. 1, Supplementary Table 2). Significant negative associations were also observed with ethanolamine plasmalogens (Fig. 1B, Supplementary Table 2).
Fig.1
Associations between Alzheimer’s disease risk factors and plasma lipid species. Linear regression analyses of risk factors against plasma lipid species were performed adjusting for covariates as indicated. The most recent available sample of each healthy control individual were used (n = 696). A, B) Associations between plasma lipids and aging. A) Lipids with a p-value less than 3.01×10⁻⁶ (top 20) are highlighted in blue. B) Ethanolamine plasmalogens, PE(P), with p < 0.05 are highlighted in light blue. C, D) Associations between lipids and gender. C) Lipids with a p-value less than 3.25×10⁻¹³ (top 20) are highlighted in red. D) Glycerophospholipids esterified with a 22:6 fatty acid with p < 0.05 (DHA, docosahexaenoic acid) are highlighted in orange. E, F) Associations between lipids and APOE ɛ4 status. E) Lipids with a p-value less than 1.13×10⁻² (top 20) are highlighted in green. F) Ethanolamine plasmalogens, PE(P), with p < 0.05 are highlighted in light green.
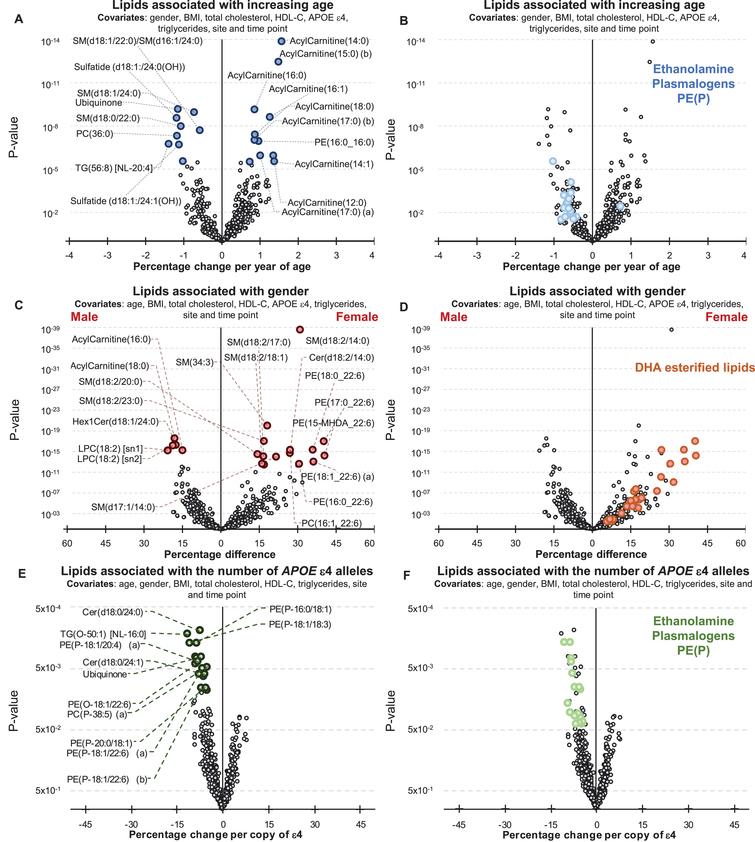
There were 385 lipid species associated with gender (299 species when covariates included clinical lipids). Sphingolipids with a d18:2 base exhibited a stronger association than other lipid species with a particularly strong association noted for the sphingomyelin, SM(d18:2/14:0) (Fig. 1C). Nearly all glycerophospholipids esterified with docosahexaenoic acid were positively associated with being female (Fig. 1D, Supplementary Table 2).
By comparison the associations between plasma lipid species and the APOE ɛ4 allele were relatively weak. There were 31 lipid species associated with APOE ɛ4 prior to correction for multiple comparisons (45 species when the analysis was also adjusted for clinical lipids). In general, the APOE ɛ4 allele was associated positively with lysophosphatidylethanolamine and acylcarnitine species, but negatively associated with phosphatidylethanolamine ether lipids including plasmalogens, PE(O) and PE(P), along with dihydroceramides, Cer(d18:0) species, and alkyldiacylglycerols, TG(O), (Fig. 1E, F, Supplementary Table 2). However, these were not significant after correction for multiple comparisons.
As APOE ɛ2 is considered to be protective against the risk of developing AD relative to APOE ɛ4, we examined the lipid associations with ɛ4 relative to ɛ2, excluding ɛ3 homozygotes. In total 127 species have an uncorrected p-value less than 0.05, 39 lipid species were associated with APOE ɛ4 after correction for multiple comparisons (Supplementary Table 2). In addition to the species described above, which typically showed stronger associations, several dihydroceramides and ceramides were negatively associated with ɛ4 (relative to ɛ2), while some cholesteryl ester species showed positive associations, other cholesteryl species showed negative associations. The phosphatidylethanolamine and lysophosphatidylethanolamine species were positively associated with ɛ4 relative to ɛ2.
Common lipid associations with Alzheimer’s disease and its risk factors
We examined the data for associations between lipid species and clinically diagnosed AD using logistic regression adjusting for the same covariates as for the risk factor analyses (Supplementary Table 2).
Comparing associations between lipid species and age in the control group, with lipid species and clinically diagnosed AD, 108 lipid species associated in the same direction with an uncorrected p-value less than 0.05 (i.e., increased with aging and increased in AD). From these, 47 lipid species that were negatively associated with AD were found to decrease with increasing age; whereas the other 61 lipid species positively associated with AD were found to increase with increasing age. There are also four lipid species, which associated opposingly between lipid species and age in the control group with lipid species and clinically diagnosed AD (Fig. 2 and Supplementary Table 4). In general, increasing age and AD were both found to be associated with decreases in ether lipids containing polyunsaturated fatty acids, higher levels of certain sphingolipid species (dependent on their acyl composition), increases in odd and branched fatty acids, decreases in ubiquinone and increases in species of phosphatidylethanolamine and triacylglycerol.
Fig.2
Common associations between plasma lipid species with Alzheimer’s disease, aging, gender, and APOE ɛ4 status. Lipids with uncorrected p-values < 0.05 were used for this analysis. Associations were adjusted for covariates as outlined in Supplementary Table 4. Associations of risk factors with plasma lipid species were performed on n = 696 controls. Associations of AD with plasma lipid species were performed on n = 696 controls and n = 268 AD. A) Common associations of plasma lipid species with age, APOE ɛ4, and AD. B) Common associations of plasma lipid species with age, gender, and AD.
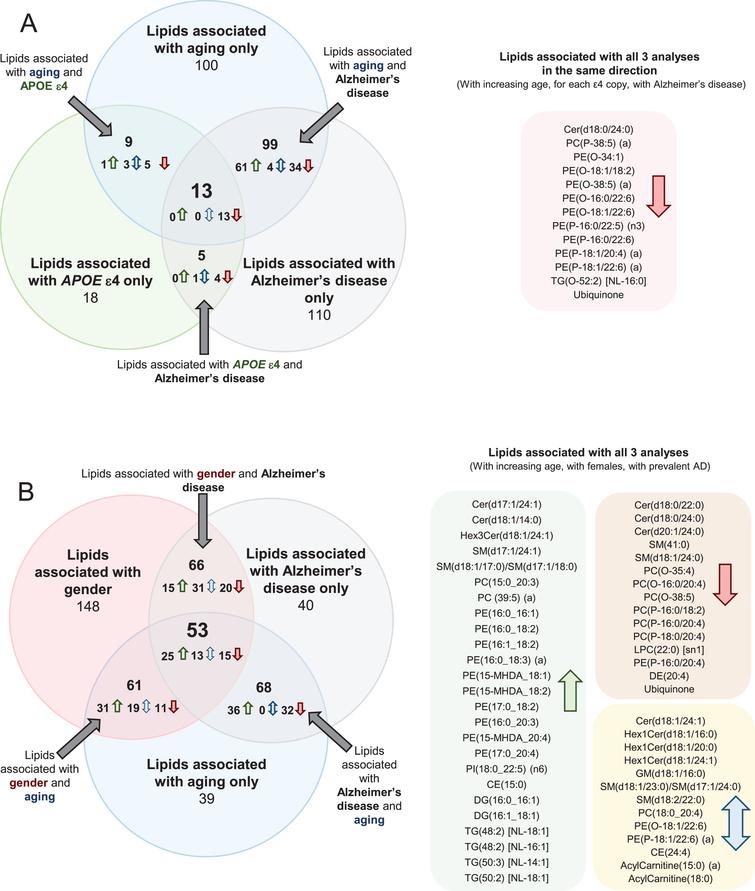
When examining the associations between lipid species and APOE ɛ4 allele status, and between lipid species and AD, there were 18 species that associated with both AD and APOE status. As the associations with APOE status were performed on control samples only and the associations with AD were performed adjusting for APOE status, these common lipid associations are independently associated with both outcomes. All of these species were negatively associated (Fig. 2 and Supplementary Table 4). Out of the 18 species associated with both APOE status and AD, 14 were ether lipid species.
There were 13 lipid species associated with aging, APOE ɛ4, and AD in a similar manner (i.e., all negatively associated). These species were predominantly ether lipids (Fig. 2 and Supplementary Table 4). We also performed these analyses adjusting for DHA supplementation and statin use, but this resulted in little difference to the associations (Supplementary Table 5).
Comparing associations between lipid species and gender in the control group, with lipid species and clinically diagnosed AD, 75 lipid species associated in the same direction with an uncorrected p-value less than 0.05 while 44 lipid species were associated in the opposite direction. Out of the 44 opposing species, 14 were sphingolipid species (Fig. 2 and Supplementary Table 4).
When examining the associations between lipid species and gender and between lipid species and age, 114 lipid species were associated with gender and age. 56 of the 114 lipid species were positively associated, 26 of the 114 lipid species were negatively associated, and the remaining 32 were associated in opposing direction. 15 of the positively associated lipid species were sphingolipid species and 16 of the positively associated lipid species were phosphatidylethanolamine species. 9 of the 32 opposing lipids were acylcarnitine species (Fig. 2 and Supplementary Table 4).
There were 53 lipid species associated with gender, aging, and AD. Of these 53 lipid species, 25 were positively associated, with 15 of the 53 lipid species negatively associated and the remaining 13 species were opposingly associated. 10 of the positively associated lipid species were phosphatidylethanolamine species (Fig. 2 and Supplementary Table 4).
Interaction of risk factors with the associations of lipid species with Alzheimer’s disease
We next tested whether lipid species were associated differently with AD; depending on age, gender, and APOE ɛ4 status. Interaction with age was tested by defining a binary cut-off at age 75, and interactions with APOE ɛ4 were tested using a binary cut for one or more ɛ4 alleles. Characteristics of this split are shown in Supplementary Table 1. There were 451 individuals (n = 390/61 controls/AD) 75 or younger and 513 individuals (n = 306/207 controls/AD) older than 75 at sample collection. Males and females had similar proportions of control and AD subjects (288/109 versus 408/159 control/AD for males and females respectively) whereas within the ɛ4+ve group, there were a much higher proportion of AD subjects (non ɛ4, 523/99 control/AD and ɛ4, 173/169 control/AD). We identified 107 lipid species, which demonstrated significant interactions with age (Fig. 3A, Supplementary Table 6). Multiple sphingolipid species showed a significant interaction with age; where species that were negatively associated with AD showed a stronger association in the younger age group (Fig. 3). Our results indicate that individuals that develop AD earlier present with a larger change in their sphingolipidome, particularly long acyl chain species thought to be synthesized by ceramide synthase 2. There was also an overall negative association with dihydroceramide seen in the younger group.
Fig.3
Interactions of age and gender with the associations between plasma lipid species and Alzheimer’s disease. Regression analysis with an interaction term identified lipid species that associated with AD differently in relation to age and gender. Analysis were adjusted for age, gender, BMI, total cholesterol, HDL cholesterol, triglycerides, site, and time-point of collection (n = 696 controls, 268 AD). A) Logistic regression examining lipid species associations with AD with an age interaction (stratified above and below 75 years of age). B) Logistic regression examining lipid species associations with AD with a gender interaction.
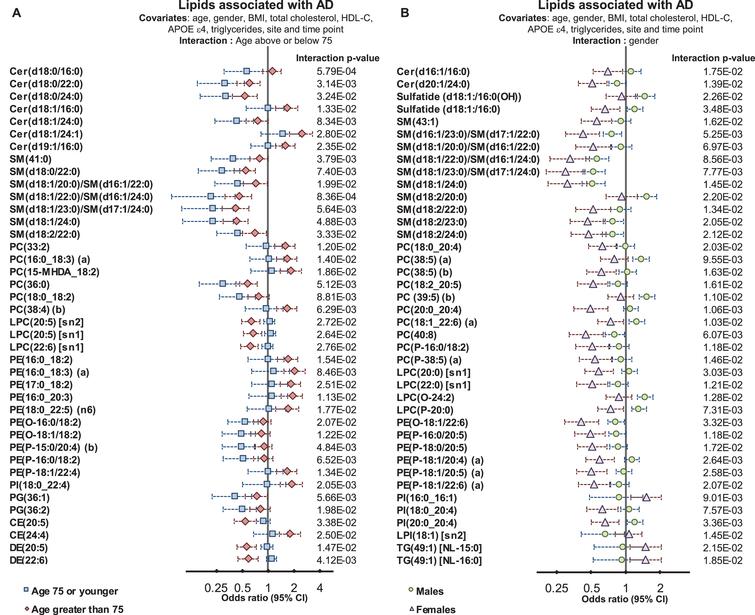
In both age groups, we observed negative associations between AD and DHA-esterified ether lipids. However, additional species were negatively associated with AD in the younger age group, including linoleic acid (18:2) and arachidonic acid (20:4) containing species. In contrast, lipid species containing particular omega-6 fatty acids such as adrenic acid, 22:4 n-6, and docosapentaenoic acid 22:5 n-6 showed stronger positive associations with AD in the older age group (Fig. 3 and Supplementary Table 5).
We next examined whether gender significantly interacted with the association between lipid species and AD. We found 71 lipid species with a significant gender interaction. The strongest interactions with gender were observed in species esterified with polyunsaturated fatty acids from both the omega-3 and omega-6 pathways. The association with AD for the ethanolamine plasmalogen, PE(P-16:0/20:5) had an odds ratio of 0.63 (95% CI 0.50–0.78, corrected p-value = 7.39×10⁻⁴, Supplementary Table 2). When examined with an interaction term (p = 1.18×10⁻²) males were not significantly associated, with an odds ratio = 0.83 (95% CI 0.61–1.14), whereas females showed a stronger association, with an odds ratio = 0.49 (95% CI 0.36–0.66, corrected p-value 1.47×10⁻⁴) (Fig. 3 and Supplementary Table 6). This same effect was seen for all species with a significant interaction, as it was found that the association between lipid species and AD was markedly weaker in males than in females (Fig. 3 and Supplementary Table 6).
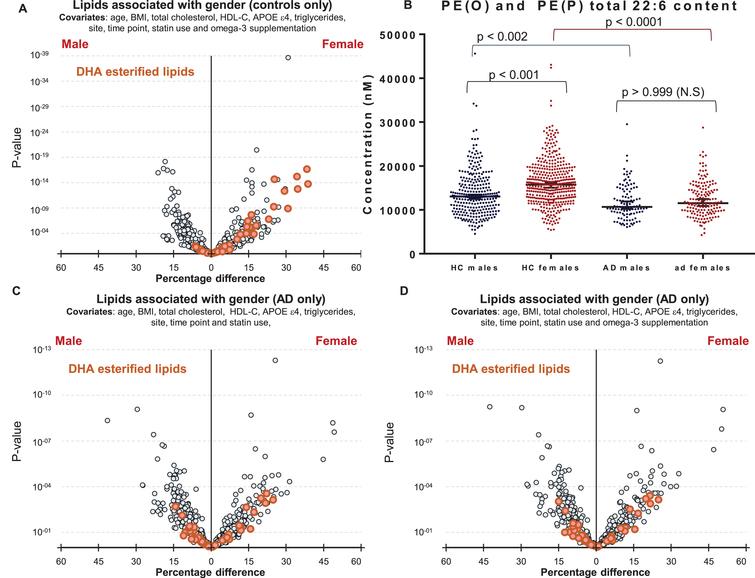
We next explored why polyunsaturated fatty acid-esterified phospholipids associated differently with AD, dependent on gender. Initial analysis highlighted differences in DHA containing lipid species between healthy control males and females (Fig. 1D). It was interesting to note that DHA lipid species are different between cognitively normal males and females (1D) even after additional adjustments for omega-3 supplementation and statin use (Fig. 4A), however these gender-specific differences was not observed in individuals with AD (Fig. 4C). Plotting unadjusted concentrations of ether lipids (22:6)-esterified highlighted the differences in concentrations of DHA ether lipids between cognitively normal men and women (Fig. 4B). The associations of gender with DHA-esterified ether lipids (Fig. 1D) were lost in the AD sub-cohort and adjustment for omega-3 supplementation had no further effect (Fig. 4C, D).
Fig.4
Associations of DHA containing lipid species with gender in control and Alzheimer’s disease groups. A) Linear regression of lipid species against gender, adjusting for clinical covariates, omega-3 supplementation and statin use using most recent samples of cognitively normal controls (n = 696). B) Concentrations of total PE(O) and PE(P) species esterified with a 22:6 fatty acid in cognitively normal males (n = 288) and females (n = 408), and in AD males (n = 109) and females (n = 159). p-values were obtained from a Dunn’s test after Kruskal-Wallis analysis. Black lines represent the median with 95% confidence intervals. C, D) Linear regression adjusting for clinical covariates using most recent samples of AD individuals (n = 268). C) No adjustment for omega-3 supplementation. D) Adjusted for omega-3 supplementation.
We observed very little interaction between APOE alleles and the lipid associations with AD. Only 10 lipid species had a significant interaction value. In general lipid associations were stronger for those without an ɛ4 allele (Supplementary Table 6).
DISCUSSION
In this study we have exploited the comprehensive lipidomic analysis of the AIBL cohort to examine in greater detail the relationship between plasma lipid species, AD risk factors (age, gender, and the APOE ɛ4 allele) and clinically diagnosed AD. We further explored the interaction of these risk factors with the associations between the lipidome and AD.
Ether lipids are associated with APOE ɛ4, aging, and Alzheimer’s disease
On examination of two major risk factors for AD, namely age and possession of APOE ɛ4 alleles, we observed common associations within the ether lipid classes, as 10 of the 13 lipid species that were independently negatively associated with aging, the ɛ4 allele, and AD, were ether lipids. Our observations are consistent with previous studies reporting lipid abnormalities in AD pathogenesis [20]. In particular a decrease in total phosphatidylethanolamine plasmalogen and a decrease in some phosphatidylcholine-plasmalogen species have been reported [9] in AD brains. The potential mechanisms of ether lipids in mediating AD risk are of great interest. It has been shown that the AβPP secretases are tightly associated with cell membranes and specifically with lipid rafts [21, 22]. In particular, the formation of Aβ is dependent on the β- and γ-secretases which are both expressed and regulated by lipid rafts; whereas in contrast, α-secretase, the enzyme that is essential for non-amyloidogenic proteolysis of AβPP, is expressed and exerts its activity via non-lipid raft membrane domains [23]. Ether lipids have been found to associate with lipid rafts [24], and Rothhaar et al. [25] identified a strong relationship between this subgroup of ether lipids—the plasmalogens (the major brain phospholipids)—and γ-secretase activity. It was found that the addition of phosphatidylcholine plasmalogens to AD brain tissue caused a reduction in γ-secretase activity [25]. Work by Grimm et al. identified dysregulation of ether lipid biosynthetic enzymes in the presence of Aβ in patients with AD [26]. In particular, alkyl-dihydroxyacetone phosphate-synthase (AGPS), a rate-limiting enzyme in plasmalogen synthesis, has been shown to be regulated by AβPP processing. Increased Aβ levels, which are observed in AD, led to peroxisomal dysfunction and reduced AGPS protein stability. This causes a reduction in AGPS protein levels and eventually a reduction in plasmalogen synthesis [26].
Another link between plasmalogens and AD comes from the finding that Aβ peptides increase phospholipase A2 activity, which is responsible for the degradation of plasmalogens [27, 28]. This may lead to a vicious cycle whereby Aβ peptides reduce plasmalogen levels and the reduced plasmalogen levels directly increase γ-secretase activity, leading to a higher production of Aβ peptides. Furthermore, oxidative stress is known to be an early event of AD pathogenesis which results in membrane damage, including the loss of plasmalogens, thereby exacerbating oxidative stress as they act as antioxidants [29], although not all studies agree on the antioxidant activity of plasmalogens [20].
Since ether lipids have been proposed to have functional roles in several aspects of metabolism that relate to the onset and progression of AD, this raises the possibility that ether lipids may be protective for AD and that the decreased levels observed with increasing age and the APOE ɛ4 allele may mediate the increased risk associated with these factors. However, further studies are required to validate these hypotheses.
Interactions between age and gender and plasma lipid levels, and their association with Alzheimer’s disease
Individuals that develop AD at a younger age are likely to exhibit more severe pathology and perform worse in cognitive tests [30, 31]. Several ceramide species, thought to be regulated by ceramide synthase 2, showed an association with AD; these ceramide species also showed a significant interaction with age, with the younger group (under 75 years) showing a stronger association between ceramide species and AD than the older group. Thus, the dysregulation of the sphingolipidome appears to be associated with earlier onset and a more severe form of the disease. Whether such changes in sphingolipid metabolism facilitate the pathogenesis of AD remains to be determined, as does the specific role of ceramide synthase 2 in the dysregulation of these lipid species.
Almost half of the lipid species measured in this study differed between males and females even after adjustment for multiple anthropometric measures and clinical lipids. We observed a dramatic shift in the effect size of the associations between lipid species and AD when using gender as an interaction term. In general, odds ratios for females were stronger (lower for negative associations, higher for positive associations) compared to males. This was particularly true for lipid species containing polyunsaturated fatty acid species, which were typically higher in females.
Several studies have indicated differences in MCI and AD prevalence between genders [32, 33], where females appear to have a higher risk [34]. Gender differences in mortality and survival rates in relation to AD have also been reported [35]. Potential biological mechanisms for these differences in risk may relate to differences in lipid metabolism. One early study examining dietary intake of omega-3 fatty acids and incident AD identified a significant interaction with gender [36], where the protective effect of dietary omega-3 fatty acids was predominately seen in women. It has previously been reported that conversion of DHA precursors to DHA is higher in women compared to men, resulting in higher circulating DHA levels [37–39].
Our results indicate higher DHA levels in cognitively normal females, but this gender difference is not observed in the AD subset, as both males and females show lower levels of lipid species esterified with omega-3 fatty acids relative to the control group. This contributes to the significant interaction between gender and the association of these lipid species with AD. Thus, in females, the higher levels of omega-3 esterified lipid species appear not to be protective, but rather show a greater decrease in AD compared to the decrease observed in males (i.e., resulting in no difference in absolute concentrations between males and females with AD). This would support the concept that omega-3 fatty acids are not in themselves protective against AD, and may explain the failure of intervention trials with omega-3 supplementation. Rather, we observe lower levels of omega-3 esterified lipid species in AD, which may represent reverse causation, in other words lower levels of omega-3 esterified lipid species may simply be part of the pathology, not a cause but the fact that the levels decrease more markedly in females may argue that the pathology is more aggressive in the latter. Further studies are needed to elucidate the mechanism behind these changes and differences in lipid levels.
The method employed in this current study enabled us to perform an in-depth examination of 582 lipid species and investigations into the relationship of age, gender, risk factors, and AD. Limitations acknowledged within the current study include the cross-sectional design of the study, and therefore further studies are required to validate the current findings longitudinally in an independent cohort. While this study is relatively large in comparison to many lipidomic and AD studies in the literature, statistical analyses to estimate interaction effects typically require larger studies to identify associations of similar effect size. This resulted in limited powered to identify all potential interaction effects, in particular disease associations derived from different APOE alleles. A second limitation, inherent to the design of the AIBL study, is the cohort enrichment for memory complainers and those diagnosed with a memory problem. Further validation should include a population cohort. Further, due to the size of the cohort examined in this study, we employed a high throughput method, which did not allow the complete separation of all isomeric species, which may have limited our ability to detect some associations.
Conclusion
We find in this study that ether lipids and plasmalogens associate with all risk factors of AD and with AD itself. While APOE ɛ4 was only weakly associated with the plasma lipidome, the inclusion of APOE ɛ2 showed stronger associations suggesting the protective effect of APOE ɛ2 may be more tightly coupled to lipid metabolism than the risk associated with the APOE ɛ4 allele. Both age and sex showed significant interactions with the associations of the lipidome with AD, although these were largely different. The interaction of age was predominantly with sphingolipids and ether lipids, while sex showed a strong interaction with the associations between omega-3 esterified lipid species and AD. This study extends our existing knowledge of the relationship between the lipidome and AD and highlights the complexity of the relationships between lipid metabolism and AD at different ages and between men and women. This has important implications for how we assess AD risk and also for potential therapeutic strategies involving modulation of lipid metabolic pathways. With further validation, lipid species have a potential to contribute as prognostic indicators of AD.
ACKNOWLEDGMENTS
The authors are grateful to the AIBL study participants and their families for their valuable contribution to this study.
Funding for the AIBL study was provided in part by the study partners [Commonwealth Scientific Industrial and research Organization (CSIRO), Edith Cowan University (ECU), Mental Health Research institute (MHRI), National Ageing Research Institute (NARI), Austin Health, CogState Ltd.]. The AIBL study has also received support from the National Health and Medical Research Council (NHMRC) and the Dementia Collaborative Research Centres program (DCRC2), as well as funding from the Science and Industry Endowment Fund (SIEF) and the Cooperative Research Centre (CRC) for Mental Health – funded through the CRC Program (Grant ID:20100104), an Australian Government Initiative. K.H was supported by a Dementia Australia Research Foundation Scholarship. PJM is supported by a Senior Research Fellowship from the National Health and Medical Research Council of Australia. This work was also supported in part by the Victorian Government’s Operational Infrastructure Support Program.
A provisional patent has been filed. Application number: App Number 2018901220; DEMENTIA RISK ANALYSIS; Baker Heart and Diabetes Institute, Edith Cowan University.
Authors’ disclosures available online (https://www.j-alz.com/manuscript-disclosures/19-1304r1).
SUPPLEMENTARY MATERIAL
REFERENCES
|
[1] |
Hebert LE , Weuve J , Scherr PA , Evans DA (2013) Alzheimer disease in the United States (2010-2050) estimated using the 2010 census. Neurology 80, 1778–1783. |
|
[2] |
Smidak R , Kofeler HC , Hoeger H , Lubec G (2017) Comprehensive identification of age-related lipidome changes in rat amygdala during normal aging. PLoS One 12, e0180675. |
|
[3] |
Hancock SE , Friedrich MG , Mitchell TW , Truscott RJ , Else PL (2015) Decreases in phospholipids containing adrenic and arachidonic acids occur in the human hippocampus over the adult lifespan. Lipids 50, 861–872. |
|
[4] |
Weir JM , Wong G , Barlow CK , Greeve MA , Kowalczyk A , Almasy L , Comuzzie AG , Mahaney MC , Jowett JB , Shaw J , Curran JE , Blangero J , Meikle PJ (2013) Plasma lipid profiling in a large population-based cohort. J Lipid Res 54, 2898–2908. |
|
[5] |
Corder EH , Saunders AM , Strittmatter WJ , Schmechel DE , Gaskell PC , Small GW , Roses AD , Haines JL , Pericak-Vance MA (1993) Gene dose of apolipoprotein E type 4 allele and the risk of Alzheimer’s disease in late onset families. Science 261, 921–923. |
|
[6] |
Sinforiani E , Citterio A , Zucchella C , Bono G , Corbetta S , Merlo P , Mauri M (2010) Impact of gender differences on the outcome of Alzheimer’s disease. Dement Geriatr Cogn Disord 30, 147–154. |
|
[7] |
Kim S , Kim MJ , Kim S , Kang HS , Lim SW , Myung W , Lee Y , Hong CH , Choi SH , Na DL , Seo SW , Ku BD , Kim SY , Kim SY , Jeong JH , Park SA , Carroll BJ , Kim DK (2015) Gender differences in risk factors for transition from mild cognitive impairment to Alzheimer’s disease: A CREDOS study. Compr Psychiatry 62, 114–122. |
|
[8] |
Huynh K , Barlow CK , Jayawardana KS , Weir JM , Mellett NA , Cinel M , Magliano DJ , Shaw JE , Drew BG , Meikle PJ (2019) High-throughput plasma lipidomics: Detailed mapping of the associations with cardiometabolic risk factors. Cell Chem Biol 26, 71–84.e74. |
|
[9] |
Grimm MO , Grosgen S , Riemenschneider M , Tanila H , Grimm HS , Hartmann T (2011) From brain to food: Analysis of phosphatidylcholins, lyso-phosphatidylcholins and phosphatidylcholin-plasmalogens derivates in Alzheimer’s disease human post mortem brains and mice model via mass spectrometry. J Chromatogr A 1218, 7713–7722. |
|
[10] |
Cheng H , Xu J , McKeel DW Jr. , Han X (2003) Specificity and potential mechanism of sulfatide deficiency in Alzheimer’s disease: An electrospray ionization mass spectrometric study. Cell Mol Biol (Noisy-le-grand) 49, 809–818. |
|
[11] |
Goodenowe DB , Cook LL , Liu J , Lu Y , Jayasinghe DA , Ahiahonu PW , Heath D , Yamazaki Y , Flax J , Krenitsky KF , Sparks DL , Lerner A , Friedland RP , Kudo T , Kamino K , Morihara T , Takeda M , Wood PL (2007) Peripheral ethanolamine plasmalogen deficiency: A logical causative factor in Alzheimer’s disease and dementia. J Lipid Res 48, 2485–2498. |
|
[12] |
Han X , Holtzman DM , McKeel DW Jr. (2001) Plasmalogen deficiency in early Alzheimer’s disease subjects and in animal models: Molecular characterization using electrospray ionization mass spectrometry. J Neurochem 77, 1168–1180. |
|
[13] |
Guan Z , Wang Y , Cairns NJ , Lantos PL , Dallner G , Sindelar PJ (1999) Decrease and structural modifications of phosphatidylethanolamine plasmalogen in the brain with Alzheimer disease. J Neuropathol Exp Neurol 58, 740–747. |
|
[14] |
Chatterjee P , Lim WL , Shui G , Gupta VB , James I , Fagan AM , Xiong C , Sohrabi HR , Taddei K , Brown BM , Benzinger T , Masters C , Snowden SG , Wenk MR , Bateman RJ , Morris JC , Martins RN (2016) Plasma phospholipid and sphingolipid alterations in presenilin1 mutation carriers: A pilot study. J Alzheimers Dis 50, 887–894. |
|
[15] |
Ellis KA , Bush AI , Darby D , De Fazio D , Foster J , Hudson P , Lautenschlager NT , Lenzo N , Martins RN , Maruff P , Masters C , Milner A , Pike K , Rowe C , Savage G , Szoeke C , Taddei K , Villemagne V , Woodward M , Ames D (2009) The Australian Imaging, Biomarkers and Lifestyle (AIBL) study of aging: Methodology and baseline characteristics of 1112 individuals recruited for a longitudinal study of Alzheimer’s disease. Int Psychogeriatr 21, 672–687. |
|
[16] |
Alshehry ZH , Barlow CK , Weir JM , Zhou Y , McConville MJ , Meikle PJ (2015) An efficient single phase method for the extraction of plasma lipids. Metabolites 5, 389–403. |
|
[17] |
White IR , Royston P , Wood AM (2011) Multiple imputation using chained equations: Issues and guidance for practice. Stat Med 30, 377–399. |
|
[18] |
Fahy E , Subramaniam S , Brown HA , Glass CK , Merrill AHJr. , Murphy RC , Raetz CR , Russell DW , Seyama Y , Shaw W , Shimizu T , Spener F , van Meer G , VanNieuwenhze MS , White SH , Witztum JL , Dennis EA (2005) A comprehensive classification system for lipids. J Lipid Res 46, 839–861. |
|
[19] |
Liebisch G , Vizcaino JA , Kofeler H , Trotzmuller M , Griffiths WJ , Schmitz G , Spener F , Wakelam MJ (2013) Shorthand notation for lipid structures derived from mass spectrometry. J Lipid Res 54, 1523–1530. |
|
[20] |
Dorninger F , Forss-Petter S , Berger J (2017) From peroxisomal disorders to common neurodegenerative diseases – the role of ether phospholipids in the nervous system. FEBS Lett 591, 2761–2788. |
|
[21] |
Ehehalt R , Keller P , Haass C , Thiele C , Simons K (2003) Amyloidogenic processing of the Alzheimer beta-amyloid precursor protein depends on lipid rafts. J Cell Biol 160, 113–123. |
|
[22] |
Cordy JM , Hussain I , Dingwall C , Hooper NM , Turner AJ (2003) Exclusively targeting beta-secretase to lipid rafts by GPI-anchor addition up-regulates beta-site processing of the amyloid precursor protein. Proc Natl Acad Sci U S A 100, 11735–11740. |
|
[23] |
Vetrivel KS , Thinakaran G (2010) Membrane rafts in Alzheimer’s disease beta-amyloid production. Biochim Biophys Acta 1801, 860–867. |
|
[24] |
Pike LJ , Han XL , Chung KN , Gross RW (2001) Lipid rafts are enriched in plasmalogens and arachidonate-containing phospholipids and the expression of caveolin does not alter the lipid composition of these domains. FASEB J 15, A20-A20. |
|
[25] |
Rothhaar TL , Grösgen S , Haupenthal VJ , Burg VK , Hundsdörfer B , Mett J , Riemenschneider M , Grimm HS , Hartmann T , Grimm MOW (2012) Plasmalogens inhibit APP processing by directly affecting γ-secretase activity in Alzheimer’s disease. ScientificWorldJournal 2012, 15. |
|
[26] |
Grimm MOW , Kuchenbecker J , Rothhaar TL , Groesgen S , Hundsdoerfer B , Burg VK , Friess P , Mueller U , Grimm HS , Riemenschneider M , Hartmann T (2011) Plasmalogen synthesis is regulated via alkyl-dihydroxyacetonephosphate-synthase by amyloid precursor protein processing and is affected in Alzheimer’s disease. J Neurochem 116, 916–925. |
|
[27] |
Sanchez-Mejia RO , Newman JW , Toh S , Yu GQ , Zhou Y , Halabisky B , Cisse M , Scearce-Levie K , Cheng IH , Gan L , Palop JJ , Bonventre JV , Mucke L (2008) Phospholipase A2 reduction ameliorates cognitive deficits in a mouse model of Alzheimer’s disease. Nat Neurosci 11, 1311–1318. |
|
[28] |
Sanchez-Mejia RO , Mucke L (2010) Phospholipase A2 and arachidonic acid in Alzheimer’s disease. Biochim Biophys Acta 1801, 784–790. |
|
[29] |
Zoeller RA , Nagan N , Gaposchkin DP , Legner MA , Lieberthal W (1999) Plasmalogens as endogenous antioxidants: Somatic cell mutants reveal the importance of the vinyl ether. Biochem J 338, 769–776. |
|
[30] |
Reid W , Broe G , Creasey H , Grayson D , McCusker E , Bennett H , Longley W , Sulway MR (1996) Age at onset and pattern of neuropsychological impairment in mild early-stage alzheimer disease: A study of a community-based population. Arch Neurol 53, 1056–1061. |
|
[31] |
Jacobs D , Sano M , Marder K , Bell K , Bylsma F , Lafleche G , Albert M , Brandt J , Stern Y (1994) Age at onset of Alzheimer’s disease: Relation to pattern of cognitive dysfunction and rate of decline. Neurology 44, 1215–1215. |
|
[32] |
Andersen K , Launer LJ , Dewey ME , Letenneur L , Ott A , Copeland JR , Dartigues JF , Kragh-Sorensen P , Baldereschi M , Brayne C , Lobo A , Martinez-Lage JM , Stijnen T , Hofman A (1999) Gender differences in the incidence of AD and vascular dementia: The EURODEM Studies. EURODEM Incidence Research Group. Neurology 53, 1992–1997. |
|
[33] |
Petersen RC , Roberts RO , Knopman DS , Geda YE , Cha RH , Pankratz VS , Boeve BF , Tangalos EG , Ivnik RJ , Rocca WA (2010) Prevalence of mild cognitive impairment is higher in men: The Mayo Clinic Study of Aging(CME). Neurology 75, 889–897. |
|
[34] |
Podcasy JL , Epperson CN (2016) Considering sex and gender in Alzheimer disease and other dementias. Dialogues Clin Neurosci 18, 437–446. |
|
[35] |
Lapane KL , Gambassi G , Landi F , Sgadari A , Mor V , Bernabei R (2001) Gender differences in predictors of mortality in nursing home residents with AD. Neurology 56, 650–654. |
|
[36] |
Morris MC , Evans DA , Bienias JL , Tangney CC , Bennett DA , Wilson RS , Aggarwal N , Schneider J (2003) Consumption of fish and n-3 fatty acids and risk of incident Alzheimer disease. Arch Neurol 60, 940–946. |
|
[37] |
Burdge GC , Calder PC (2005) Conversion of alpha-linolenic acid to longer-chain polyunsaturated fatty acids in human adults. Reprod Nutr Dev 45, 581–597. |
|
[38] |
Burdge GC , Wootton SA (2002) Conversion of alpha-linolenic acid to eicosapentaenoic, docosapentaenoic and docosahexaenoic acids in young women. Br J Nutr 88, 411–420. |
|
[39] |
Burdge GC , Jones AE , Wootton SA (2002) Eicosapentaenoic and docosapentaenoic acids are the principal products of alpha-linolenic acid metabolism in young men*. Br J Nutr 88, 355–363. |


